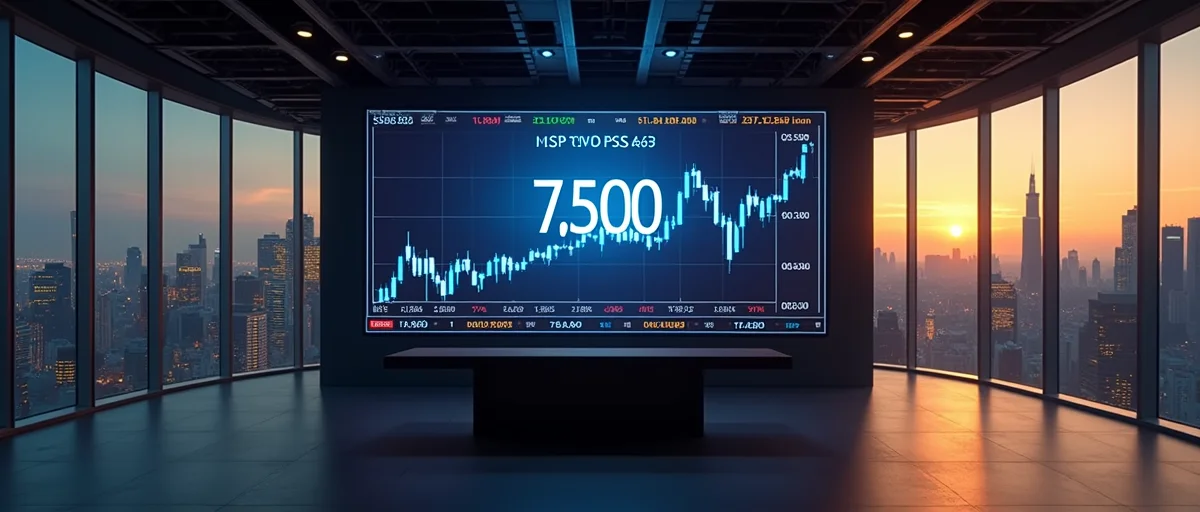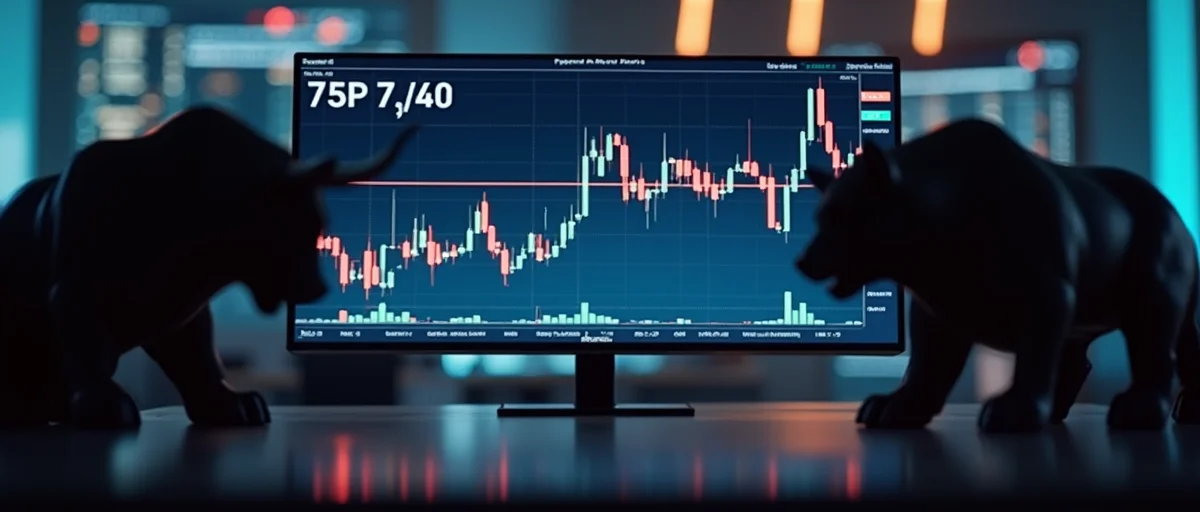
The S&P 500 is stuck at 7,500. Options market makers are holding the range, but an obscure index could trigger the next breakout or breakdown. Here's why.
The S&P 500 is stuck in a high-stakes tug-of-war around 7,500. This key battleground level has frustrated both bulls and bears, with neither side able to establish clear control. As the index oscillates in an unusually tight range, an obscure market index is quietly emerging as the signal that could determine the next directional move. For technology professionals tracking financial markets, understanding these mechanics isn’t just academic — it’s essential for portfolio positioning in the weeks ahead.
For recent trading sessions, the S&P 500 has orbited 7,500 like a planet caught in a gravitational field. Every dip below the level attracts buyers; every rally above it attracts sellers. This has created a stalemate, with equal pressure from both sides producing an unusually narrow price band.
This level is not just a round number. It’s a point where multiple technical factors converge: prior support and resistance levels, heavy options open interest, and institutional target pricing. When such factors align, markets tend to consolidate. And as any systems engineer knows, the longer a system remains in equilibrium, the more explosive the eventual release.
Key characteristics of the current battleground:
According to recent trading data, this pattern has persisted across multiple sessions. Neither side has the momentum to claim a decisive victory, leaving the index in a technical no-man’s land.
Much of this price anchoring can be traced to Chicago, where options traders and market makers have been actively managing their risk around the 7,500 strike. Research indicates that these participants are buying dips below 7,500 and selling rallies above it. The net effect is a self-reinforcing range that suppresses volatility and keeps the underlying index pinned.
Options market makers serve a critical function in modern markets: they provide liquidity by always taking the other side of a trade. But because they are required to remain market-neutral, their hedging activity directly influences spot prices. Around heavily traded strikes like 7,500, this often creates a “pinning effect” that tethers the index to the strike price.
For technology professionals, this is best understood as a feedback loop:
This stabilizing mechanism doesn’t last forever. When external demand overwhelms the hedging activity — from macro news, earnings surprises, or shifting institutional flows — the feedback loop breaks, often with outsized consequences.
Perhaps the most intriguing element of today’s market structure is the growing focus on an obscure market index that few retail traders follow. This index, derived from proprietary signals in the derivatives marketplace, is being closely watched by institutional players as a potential leading indicator for the S&P 500’s next big move.
While the mainstream financial conversation fixates on the S&P 500’s round number and daily headlines, this underlying index tells a deeper story. It captures the real-time positioning of professional traders, the flow of hedging activity, and the shifting balance between fear and greed. When this index moves decisively, it often registers before the S&P 500 makes its own move.
You don’t need an advanced trading terminal to benefit from this knowledge. If you hold S&P 500 index funds, tech ETFs, or individual large-cap technology stocks, the next major move in the index will directly impact your portfolio. Understanding the signals that move markets — even the obscure ones — is part of building an informed and resilient investment strategy.
Practical applications for the informed investor:
Should the S&P 500 finally close decisively above 7,500, the move could be swift and self-reinforcing. Many bears have built positions around this level, anticipating a reversal. When price breaks above a contested zone, those traders must cover their short positions, adding fuel to the rally.
In a breakout scenario, three compounding forces often accelerate the move:
The result is often a sustained move that surprises those who expected the range to hold. Historically, tight consolidations that resolve upward tend to deliver above-average follow-through over the subsequent weeks.
A decisive break below 7,500 paints a very different picture. If institutional buyers who have been supporting the level step aside, the same feedback loop that once stabilized the market reverses direction. What was once a floor becomes a ceiling.
Breakdown dynamics to watch:
In that scenario, the next major support zone could come into play quickly. Downside moves from tight ranges are historically faster than upside moves, because fear is a stronger emotion than greed.
You spend your working hours analyzing complex systems. The stock market is no different. A system under pressure always seeks release — and the S&P 500 at 7,500 has been under pressure for multiple sessions.
Here is a practical playbook for navigating the decision point:
The S&P 500 is at a critical crossroads. Options market makers are doing their part to keep the index anchored at 7,500, but no force in markets is permanent. The obscure index watched by a small but influential group of institutional traders could provide the earliest signal of which way the battle turns.
For technology professionals, the message is clear: study the systems, respect the signals, and position for the move that is coming. The 7,500 battleground will not hold forever, and when it dissolves, the S&P 500’s next sustained trend will begin.
As always, markets reward preparation over prediction. The data from CNBC’s reporting makes one thing certain: the tension at 7,500 is building. Identify your biases, set your alerts, and let the market’s own signals — not short-term emotion — guide your next step.
It means the index is trading in a very narrow range around that level, with buyers stepping in on dips below it and sellers capping rallies above it. This creates a stalemate, often a precursor to a larger move. The level itself is significant because it combines prior support and resistance, heavy options activity, and institutional target pricing.
Options market makers are required to take the opposite side of trades to provide liquidity. Around the 7,500 strike, they actively buy when the index dips below that level and sell when it rallies above, effectively keeping the price within a range. This process suppresses volatility and can create a self-reinforcing trading band.
The article suggests that an obscure market index, separate from major indices like the S&P 500, is becoming a key signal for the next directional move. Such indices often track specialized segments or volatility relationships and can reveal shifts in market stress or liquidity that are not visible in headline indexes. Traders watch these signals for early clues of a breakout or breakdown.
Many traders wait for a confirmed break above or below a battleground level before making large adjustments, as false moves can occur within a range. You can monitor volume, volatility, and the obscure index mentioned in the article for additional confirmation. If you need a systematic approach, consider using stop-losses or options strategies to manage risk during the breakout attempt.
After a prolonged tight range, markets often experience an explosive move once one side exhausts the other. The longer the consolidation, the larger the eventual breakout or breakdown tends to be. However, the direction is uncertain, so risk management becomes especially important during this phase.