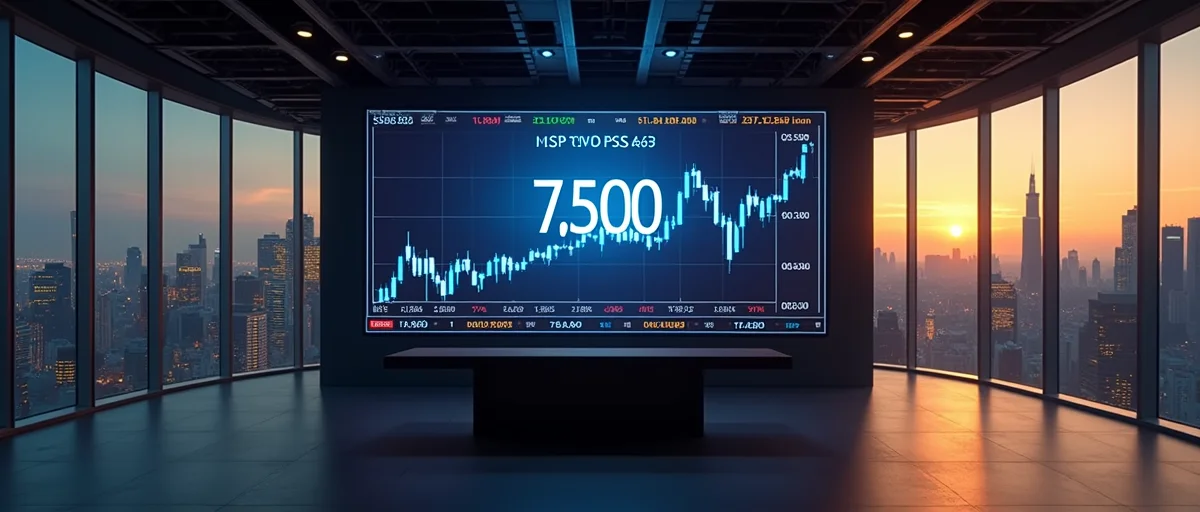
The S&P 500 remains locked around 7,500 as options traders create support and resistance on both sides. An obscure index tracked by Chicago market makers could provide the catalyst for the next major move.
The S&P 500 is stuck at a key battleground level: 7,500. For weeks, the benchmark has hovered in a narrow range as options traders repeatedly buy dips below that threshold and sell rallies above it. A July 2026 CNBC report shows that market makers in Chicago are actively defending this level, creating an unusually well-defined trading range. Now an obscure index could determine the market’s next move. For technology professionals, the outcome matters beyond stock tickers. It can shape valuations, capital costs, and product roadmaps.
Round numbers have always attracted attention. On trading screens, 7,500 is more than a round number; it is a line in the sand. According to CNBC data from July 2026, options traders have been providing both support and resistance at this exact level. Buyers appear quickly below 7,500, and sellers appear just as quickly above it. The result is a market that respects the level more than most recent headlines.
This is not random behavior. Options activity tends to cluster around strike prices with high open interest. When the S&P 500 approaches 7,500, dealers and market makers must adjust their hedges. Those adjustments amplify the stall. Oversimplified, the index is pinned between two forces: dip buyers and rally sellers.
For technology investors, this creates a familiar pattern. A rangebound market can feel stable, but the stability is mechanical, not fundamental. The market is not saying that economic data are irrelevant. It is saying that derivatives flows are temporarily offsetting macro signals.
Market makers in Chicago sit at the center of this dynamic. As options change hands, they must keep their books balanced. To do that, they buy and sell index futures. Those futures flows create pressure that pushes the index back toward the strike price.
In other words, the defense of 7,500 is not a coordinated conspiracy. It is an unintended consequence of hedging. When the index dips slightly below the level, dealers buy futures to offset put exposure. That buying acts as a floor. When the index rallies, dealers sell futures to offset call exposure. That selling acts as a ceiling.
The result is a self-reinforcing loop. The more options positions there are near 7,500, the more difficult it is for the S&P 500 to escape the zone.
A narrow trading range feels calm. Under the surface, the risk may be growing. The longer the S&P 500 holds 7,500, the more derivatives contracts accumulate around that strike. Eventually, when price does break out, dealers may unwind hedges in the same direction. That can turn a routine breakout into an accelerated move.
Think of it like a spring being compressed. The force applied by market makers keeps the index stable, but it also stores energy. A serious fundamental shock or a shift in the obscure index can release that energy. For portfolio managers and technology executives, the real danger is being positioned for calm when the spring snaps.
Options gamma is the technical concept at work. When market makers are short gamma, their hedging can amplify price moves. When they are long gamma, their hedging can dampen them. The current 7,500 range suggests a long-gamma environment. That can feel quiet, but it can also expire quickly. Monthly options expiration may be the first test of whether the S&P 500 escapes the level.
According to the CNBC report, the next catalyst may come from an obscure index, not from the S&P 500 itself. The report does not point to a familiar macro headline. It points to a secondary gauge followed closely by Chicago market participants. That detail matters because price alone rarely tells the full story.
An obscure index can reveal hidden dynamics that the benchmark masks. In many trading desks, this gauge is treated as an early-warning system. It may be designed to answer one or more of the following questions:
For technology professionals, these are not abstract questions. They affect access to capital, the cost of hedging, and the timing of major investments. A fast-growing startup may postpone an IPO if the S&P 500 breaks down. A hardware company may accelerate production if a breakout confirms demand.
In a market dominated by algorithms, obscure data matters more than ever. Quantitative systems monitor dozens of indexes and signals. One hidden divergence can trigger automated selling before human analysts notice. The quiet range around 7,500 gives these systems time to build exposure in one direction. When the obscure index changes, the next move may arrive quickly.
Technology professionals know the value of telemetry. A server can run at full capacity while error rates remain low, but one hidden queue metric can forecast an outage before users complain. The S&P 500 is the user-facing dashboard. The obscure index is the internal telemetry.
By watching only the benchmark, investors miss early signals. The obscure index may track implied volatility for out-of-the-money options. It may measure the skew between puts and calls. It may capture the breadth of participation beneath the headline index. Each of these measurements can be a leading indicator, while the S&P 500 remains a lagging snapshot of the entire market.
The exact construction of the obscure index matters less than what it represents. It is a mechanism for observing stress before it reaches the main index. In that sense, it is a risk sensor, and ignoring it is a form of risk blindness.
The S&P 500 is a capitalization-weighted basket. A handful of large companies can move the index even when most stocks are falling. That is why an obscure index matters. It can separate the signal from the noise.
Professional investors understand this. They monitor equal-weight versions of the S&P 500, volatility surfaces, and market breadth. The 7,500 battleground may simply be a surface level. Underneath, positioning and sentiment are shifting. Those shifts are often captured first in a less-followed gauge.
For technology professionals, the lesson is to avoid relying on a single dashboard. Just as a distributed system requires tracking multiple metrics, the market requires more than one index. Using the obscure index alongside the S&P 500 can improve forecasts and risk decisions.
The S&P 500 is heavily influenced by technology names. If the index breaks above 7,500, risk appetite can return quickly. Capital may rotate into growth, artificial intelligence, and high-multiple software stocks. If the index breaks below support, the same capital may move toward defensive sectors and cash.
For technology professionals, both paths demand preparation.
In an upside breakout, internal teams may need to revisit hiring plans and procurement decisions. A rising market can bring more venture funding, more enterprise deals, and more urgency around innovation. In a downside breakout, budgets may tighten, product launches may slow, and risk management becomes the priority.
The direction of the break matters less than the plan. The worst position is to be surprised. That is why the obscure index is important. It may produce a lead time that does not appear in the S&P 500 price itself.
The 7,500 level is not a prediction; it is a decision point. Technology investors and leaders can use it to build contingency plans. Here are five practical actions to consider:
The goal is not to guess the exact direction. The goal is to be ready for either outcome with clear triggers and defined responses.
As of July 2026, the S&P 500 remains locked near 7,500. CNBC data shows that options traders are providing steady support and resistance. Market makers in Chicago are actively defending the level. Meanwhile, an obscure index is emerging as the potential catalyst for the market’s next move.
For technology professionals, this is a moment to think in systems. The benchmark price is just one output. The options market, market-maker hedging, and the obscure index are parts of a larger feedback loop. When the loop breaks, the move can be fast.
Stay patient. Respect the range. Watch the hidden gauges. The S&P 500’s next move will not come from nowhere, and the obscure index may be the first to show it.
Source: CNBC, July 2026.
The 7,500 level is a battleground because options traders have placed significant positions at that strike. When the index dips below it, market makers buy futures as hedges, creating support; when it rallies above it, they sell futures, creating resistance. This mechanical flow can pin the index in a narrow range regardless of fundamental news.
Market makers keep their options books balanced by trading index futures. If the index falls, dealers buy futures to hedge put options they've sold, which tends to push the index back up. If it rises, they sell futures to offset call exposure, which tends to pull it back down. These flows are reactive and can amplify the stall at a level like 7,500.
The article does not name the obscure index, but it is described as an internal market maker measure tracked by Chicago traders. It likely reveals options positioning or dealer inventory in a more granular way than public data. A shift in this index could signal whether the support or resistance at 7,500 is about to give way.
Short-term options flows can indicate likely market ranges, which affect valuation models, capital costs, and timing for product launches. By tracking when the S&P 500 is pinned by derivatives, you can avoid overreacting to noise and focus on medium-term fundamentals. However, these levels are not permanent guides—they can break suddenly, so hedge your planning against that risk.
The main risk is that these levels depend on existing positions and can collapse if options expire or market makers unwind hedges. They reflect mechanical flows, not intrinsic value, so they provide no protection during a genuine fundamental shock. Investors who treat them as ironclad can be caught off guard when the range finally breaks.